Monthly Asset Rotation Study- Momemtum, Volatility Impacts
A backtest simulation was performed to help understand the impact of two simple technical metrics applied sequentially to understand their role in an algorithm to rank the top two funds in a portfolio to buy each month.
Active Asset Rotation is a technique to rotate investments into the funds likely to do well for the following month. (or other period) The concept is being talked about quite a bit on investment forums, kicked off by some good books out there such as “The Ivy Portfolio” and “Asset Rotation”.
These are ETFs with history going back to mid-2006 at least from different asset classes and sectors. It’s important to have funds that have poor correlation in the mix to be able to rotate to sectors or classes in favor. We should do another blog on correlation in the future.
Often momentum is a key metric used for the algorithms, frequently the only metric on systems shared publicly. It’s impressive something that simple does seem to have the ability to often beat the S and P 500. (Represented by the SPY ETF)
We looked at momentum ranking the funds with different time periods. To do this we simply look at the return of each fund over the chosen period and rank accordingly. Sell any funds following this system currently held not the top two ranked. Buy the top two funds on the close of the first trading day of the month, providing you don't already own them. There is never a question of when to buy or sell once one decides to follow the system.
First we look at a 6 month look back period. In other words rank based on 6 month return performance and buy the top two.
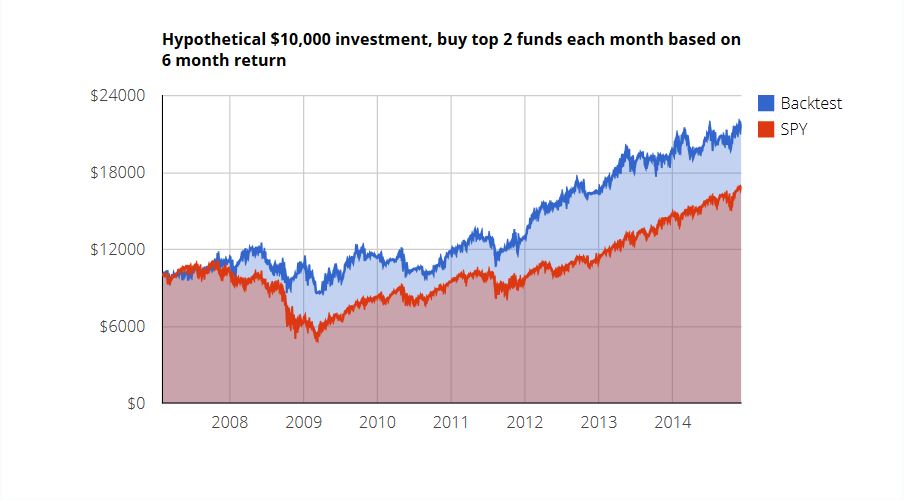
| investment | % gain on ave | sdev of Monthly change | CAGR over entire backtest | Max Drawdown % | MAR ratio(CAGR/drawdown) | percent of months above 0% |
|---|---|---|---|---|---|---|
| Backtest | 0.91 | 4.37 | 10.28 | -26.91 | 0.38 | 66.32 |
| SPY | 0.75 | 4.73 | 6.85 | -52.89 | 0.13 | 63.16 |
We can see that this is a market beating system, with higher returns and lower drawdowns than the SPY. What's a drawdown? Its the max peak to valley depth of periods negative return, based on monthly performance. Lower drawdown over a long period of time is associated with lower risk. If you loose 50%, to only get back to even, you have to gain 100%. I'll bet you knew that, but sometimes I need a reminder of how damaging losses or drawdowns can be. Its easy to see that we want to minimize drawdowns. MAR ratio is simply the Compounded Annual Growth Rate (CAGR) / Drawdown for the entire period. This is a risk adjusted returns metric, higher is better of course.
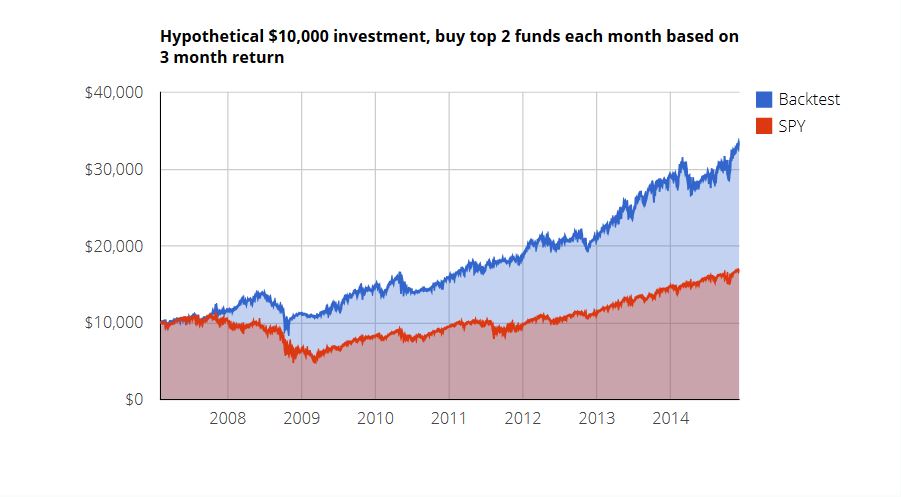
Lets look at a 3 month look back period now, below. In other words rank based on 3 month return performance and buy the top two.
| investment | % gain on ave | sdev of Monthly change | CAGR over entire backtest | Max Drawdown % | MAR ratio(CAGR/drawdown) | percent of months above 0% |
|---|---|---|---|---|---|---|
| Backtest | 1.36 | 4.09 | 16.48 | -24.22 | 0.68 | 68.42 |
| SPY | 0.75 | 4.73 | 6.85 | -52.89 | 0.13 | 63.16 |
This is an improvement over 6 month in about every way.
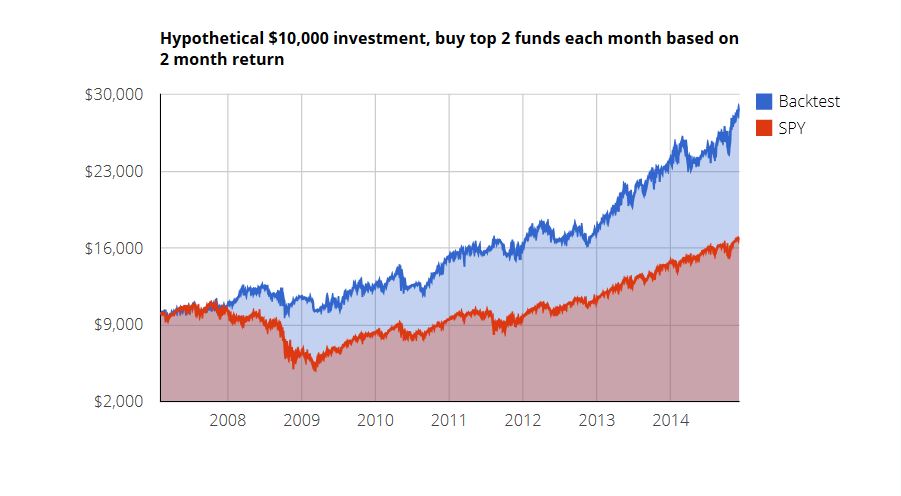
How about 2 month look back period, see below.
| investment | % gain on ave | sdev of Monthly change | CAGR over entire backtest | Max Drawdown % | MAR ratio(CAGR/drawdown) | percent of months above 0% |
|---|---|---|---|---|---|---|
| Backtest | 1.19 | 3.77 | 14.26 | -17.15 | 0.83 | 65.26 |
| SPY | 0.75 | 4.73 | 6.85 | -52.89 | 0.13 | 63.16 |
Mixed result. CAGR went down but MAR is higher due to smaller drawdown. I put priority on the MAR to choose 2 months as better than 3. This is why I like to use the MAR, helps to keep the big picture in mind. The TradeInformed big picture= "minimize losses and beat the market". Some like to use Sharpe ratio instead but the Sharpe ratio uses volatility to risk adjust, and I prefer to use drawdowns as this is more important to me.
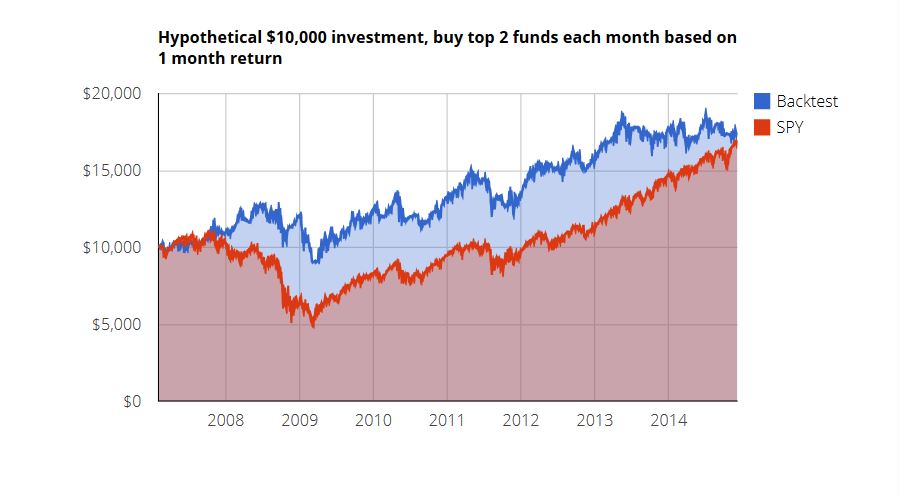
Lets check 1 month look back next, below. Hope you are enjoying this, I am!
| investment | % gain on ave | sdev of Monthly change | CAGR over entire backtest | Max Drawdown % | MAR ratio(CAGR/drawdown) | percent of months above 0% |
|---|---|---|---|---|---|---|
| Backtest | 0.67 | 4.14 | 7.27 | -28.45 | 0.26 | 62.11 |
| SPY | 0.75 | 4.73 | 6.85 | -52.89 | 0.13 | 63.16 |
Not so good, we went too far. 2 months is best. Still beating market with twice the MAR ratio though! The fact that all cases actually beat the market over a pretty decent period of time for the SPY gives me some confidence in this concept.
Now we will try a penalty for volatility and 2 month return. I tried a few levels, will show a couple so this post doesn't get crazy long.
Below is 2 month return with a 25% volatility penalty ranking. In other words, take the 2 month return (normalized to per month return) and then subtract 25% of one month volatility and rank accordingly. Still using the top two funds.
| investment | % gain on ave | sdev of Monthly change | CAGR over entire backtest | Max Drawdown % | MAR ratio(CAGR/drawdown) | percent of months above 0% |
|---|---|---|---|---|---|---|
| Backtest | 1.16 | 3.60 | 14.02 | -17.01 | 0.82 | 66.32 |
| SPY | 0.74 | 4.73 | 6.76 | -52.89 | 0.13 | 63.16 |
Not any help compared to just using 2 month return alone.
Below is 2 month return with a 4X volatility penalty ranking. In other words, take the 2 month return (normalized to per month return) and then subtract 400% of one month volatility.
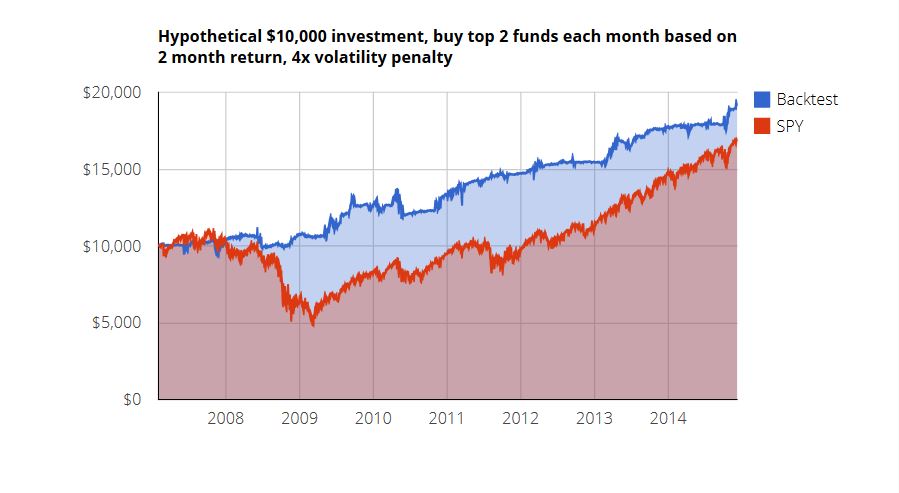
| investment | % gain on ave | sdev of Monthly change | CAGR over entire backtest | Max Drawdown % | MAR ratio(CAGR/drawdown) | percent of months above 0% |
|---|---|---|---|---|---|---|
| string | number | number | number | number | number | number |
| Backtest | 0.71 | 2.40 | 8.51 | -10.18 | 0.84 | 69.47 |
| SPY | 0.74 | 4.73 | 6.76 | -52.89 | 0.13 | 63.16 |
Here we do see an advantage over just using 2 month momentum in terms of MAR ratio. Nice control of drawdowns. Much lower CAGR though. Hmm is there a way to get our cake and eat it too?
Below we have 2 month return and the TradeInformed adaptable volatility penalty. We are keeping the details of this feature proprietary but what it does is apply different volatility penalty based on how the market is doing. In other words, if the market is in a downturn, penalize 2 month return ranking severely for volatility and less so for other cases. High penalty for volatility shifts lower risk funds to the top of the ranking.
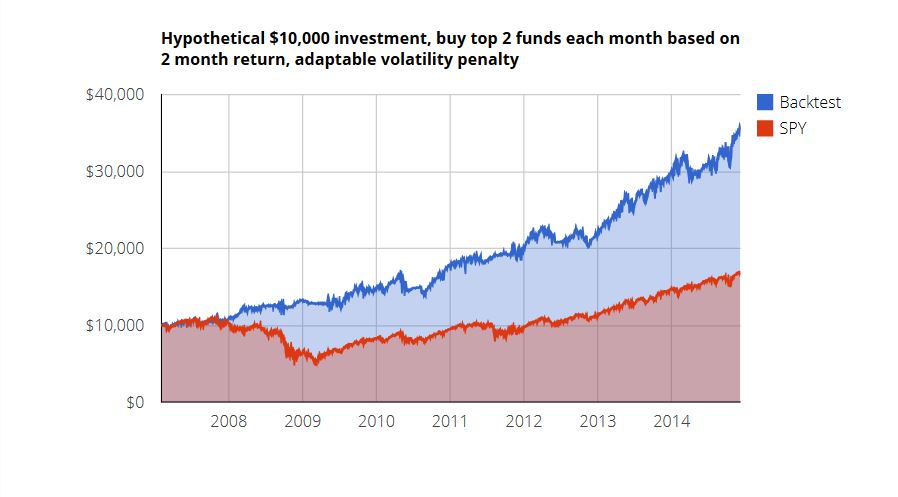
| investment | % gain on ave | sdev of Monthly change | CAGR over entire backtest | Max Drawdown % | MAR ratio(CAGR/drawdown) | percent of months above 0% |
|---|---|---|---|---|---|---|
| Backtest | 1.41 | 3.38 | 17.47 | -12.22 | 1.43 | 66.32 |
| SPY | 0.75 | 4.73 | 6.85 | -52.89 | 0.13 | 63.16 |
That made a difference! Nice, best of both worlds.
At this point you may be getting concerned that we are getting too many bells and whistles on this thing. Remember we are only penalizing for volatility, which is a conservative measure rather than adding risk. If we had no volatility feature at all it still beats the market for the test period. This is why we think its a safe area to tweak.
This is probably a good place to stop for this post. Thanks for reading. I wonder if anyone actually made it this far..
Conclusions:
- Active Asset Rotation applied on a monthly basis shows great potential to minimize losses and beat the market using a simple momentum ranking and holding two funds based on this simulation.
- MAR ratio is the compounded annual return/ drawdown for the entire period. This is a good way to risk adjust the returns in the author's opinion.
- Adding a penalty to the funds for volatility helps to minimize drawdowns and maximize the MAR if the proper weighting is found, with the tradeoff often associated with lower risk- lower returns.
- Utilizing an adaptable volatility penalty shows that drawdowns can be minimized with no real penalty to returns.
2 Comments
Great article, keep them coming please!
February 21, 2015
Thanks so much, Robert. We will try to do a better job of keeping the articles flowing. Other duties have been consuming too much time. Have a great day.
March 31, 2015